
2025 Service Requests
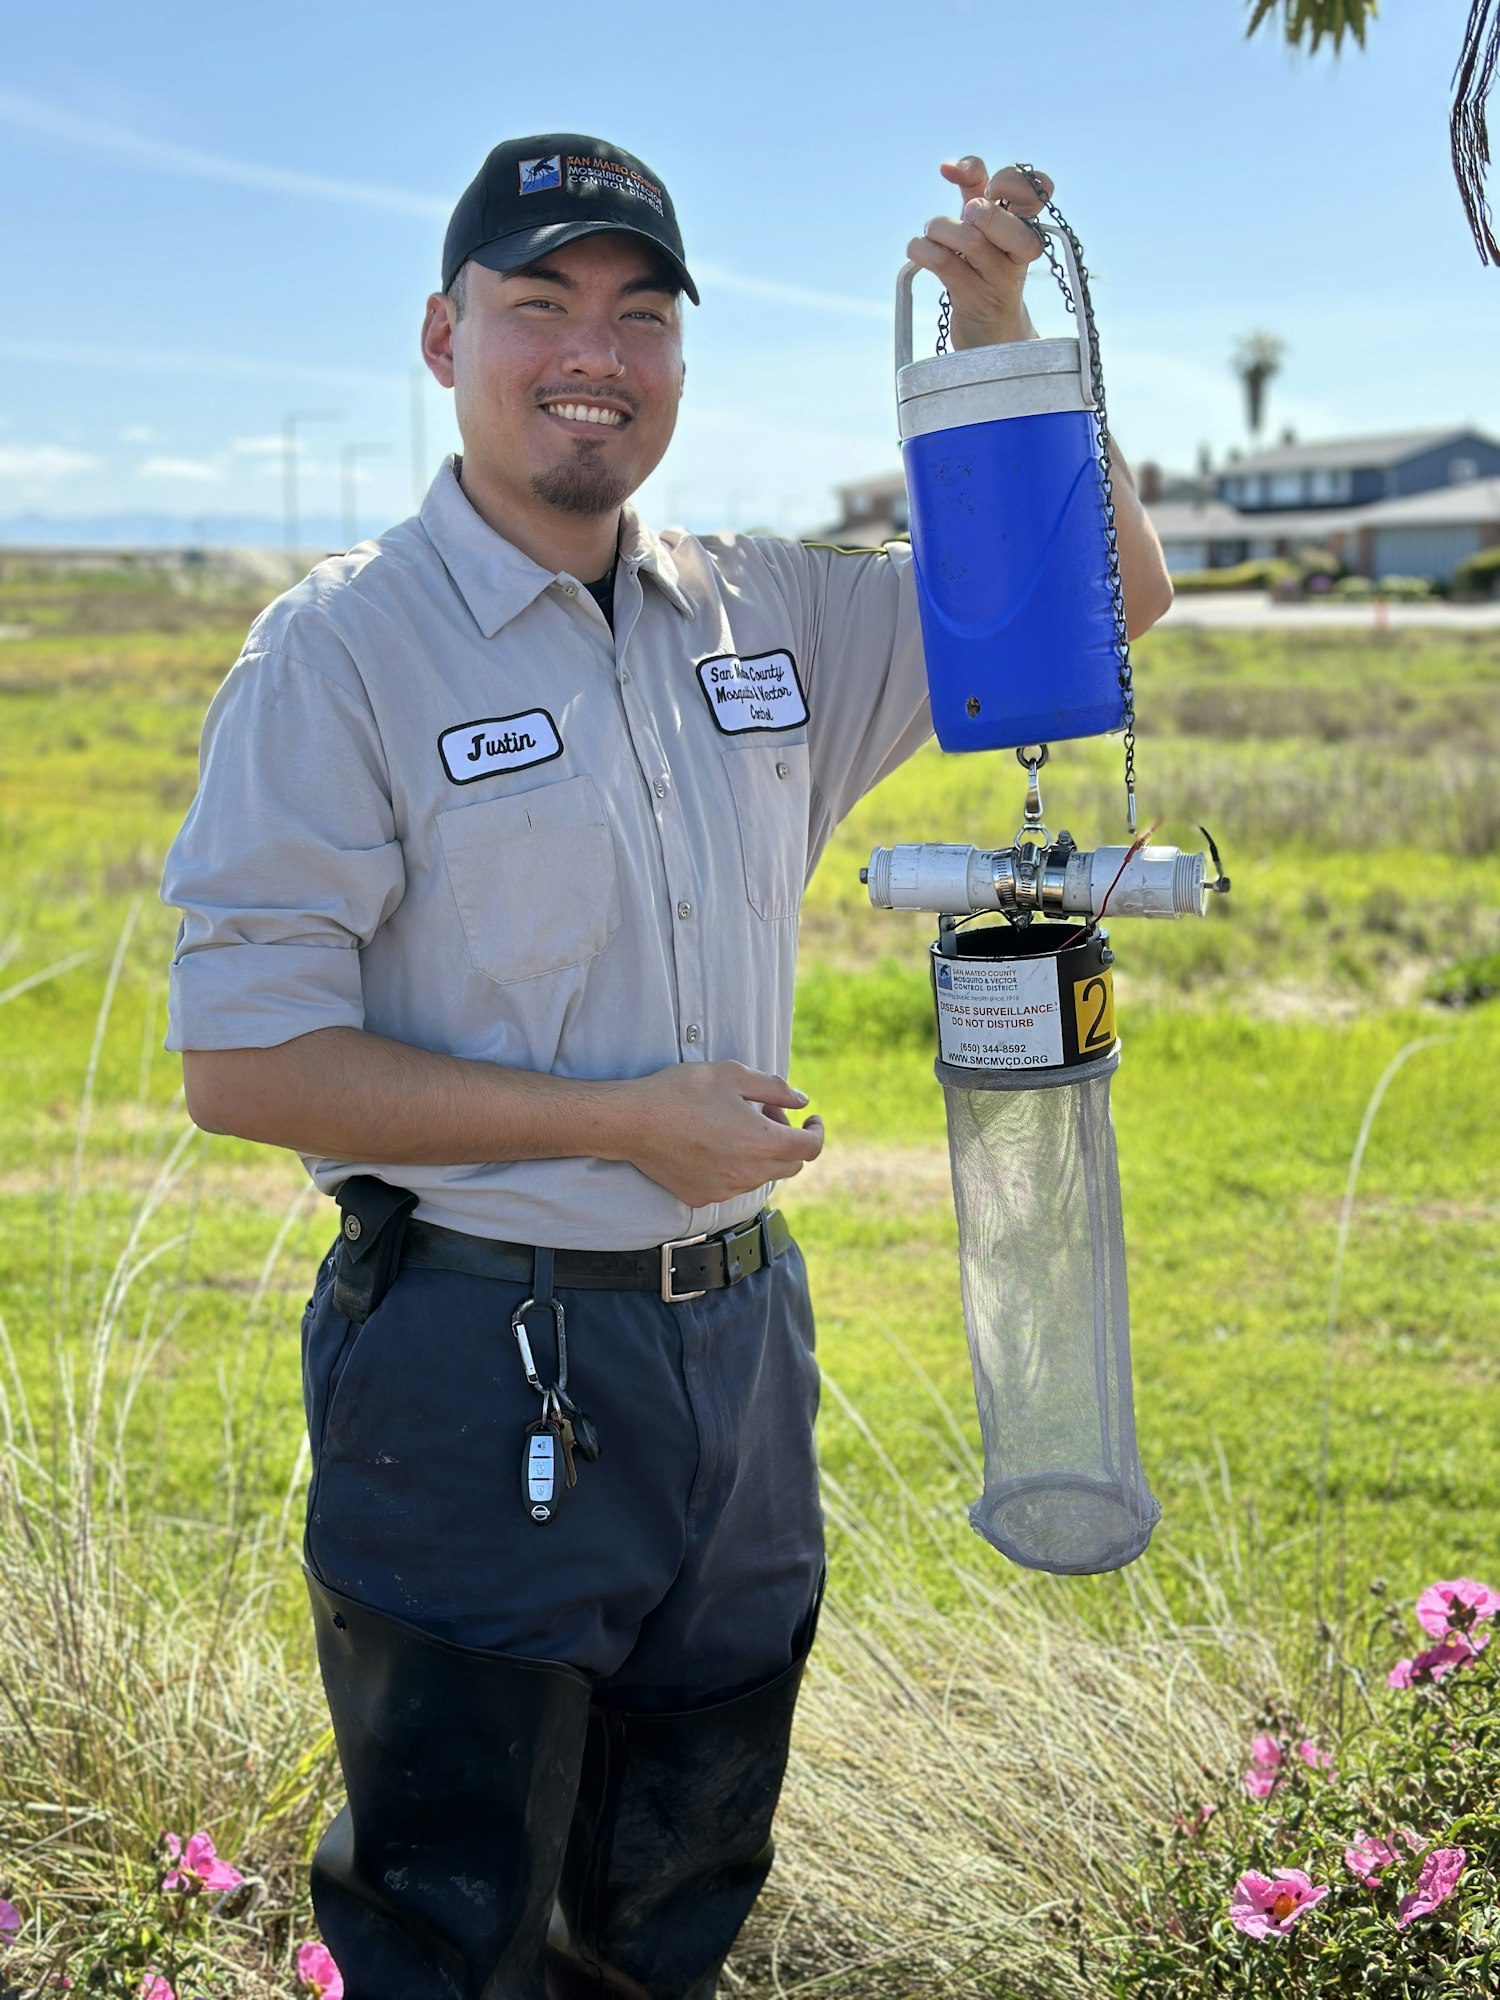
Vector Control Technician Justin Loman hangs a carbon dioxide-baited trap in response to a resident's request for help with mosqitoes.
The total number of service requests in December was near average (129 requests compared to a five-year average of 136). Each category was also close to average, with the largest difference in rodent-related requests (40 compared to a five-year average of 50).
Service requests in the category “other” included cockroaches and midges.
| Type of Request | December 2025 | December 5-year average (2021-2025) |
|---|---|---|
| Rodents | 40 | 51 |
| Mosquito | 29 | 26 |
| Ticks | 19 | 23 |
| Dead birds | 11 | 7 |
| Yellowjackets/wasps | 10 | 11 |
| Insect identification | 8 | 8 |
| Wildlife | 5 | 3 |
| Mosquitofish | 2 | 3 |
| Other | 5 | 5 |
| Total | 129 | 136 |
This graph shows the number of service requests of each category from each month of 2025.
Page last reviewed: January 7, 2025